Cohort Analysis Membership Retention: A Practical Runbook
Cohort Analysis Membership Retention: A Practical Runbook

Cohort analysis shows exactly when new members stop engaging so you can target the specific week your program leaks people, instead of guessing at churn from a monthly total. That single shift, from average churn to age-based retention curves, is what separates membership teams that fix retention from teams that just report it.
The numbers back the urgency. Bain & Company’s oft-cited finding that even small retention gains can multiply profits disproportionately still holds for subscription and paid-community businesses. On the creator side, Money-plug has tracked over $500,000 in revenue across seven program launches, including one that landed more than 3,000 sales in ten days, largely because the team watched cohort behavior instead of top-line signups.
Start this week with three moves:
- Pick one immutable anchor date (first payment, not signup click) and stick with it.
- Build a month-0 cohort matrix before touching anything else.
- Inspect month-1 retention specifically. That’s where most membership programs bleed the most members.
Key Takeaways
Cohort analysis works because it isolates when specific groups of members disengage, turning a vague churn number into a targeted, testable intervention point.
| Point | Details |
|---|---|
| Anchor on first payment | Use first successful payment, not signup click, as the immutable member_since date. |
| Run acquisition cohorts first | They’re cheapest to build and reveal whether retention is trending better or worse. |
| Watch month-1 drop-off | Most membership programs lose the largest share of members in the first month. |
| Separate logo from revenue cohorts | Member count retention and MRR retention can diverge sharply across tiers. |
| Match the fix to the curve shape | Sharp early drops need onboarding fixes; continuous decay needs a value proposition audit. |
Table of Contents
- What Cohort Analysis Membership Tracking Actually Reveals
- Types of Cohorts to Run for Membership Programs
- Data Requirements and Metrics for Reliable Membership Cohorts
- How to Build a Membership Cohort Matrix Step by Step
- Reading Retention Curves and Turning Them Into Action
- Common Mistakes That Break Membership Cohort Analysis
- How Money-plug Uses Cohort Thinking in Creator Launches
- What This Runbook Gets Right That Most Advice Misses
- Sources
What Cohort Analysis Membership Tracking Actually Reveals
Cohort analysis groups members who joined at the same time and tracks what percentage stick around at each age interval afterward. For memberships, that means answering a question a blended churn rate can’t: did the members who joined during your February promo behave differently by month three than the ones who joined in a normal month?
This matters because monthly churn hides cohort quality. Cohort analysis exposes that gap by isolating each joining group and following it forward in time, month by month, rather than averaging everyone together.
The standard industry term for this is retention cohort analysis, and it’s distinct from simple churn reporting in one key way: it’s longitudinal. You’re not asking “how many members left this month,” you’re asking “of the members who joined in month X, how many are still active in month X plus 3, plus 6, plus 12.”
Types of Cohorts to Run for Membership Programs
Different cohort types answer different questions, and running the wrong one first wastes weeks. Acquisition cohorts group members by join date or join channel, and they answer “is retention getting better or worse over time.” Behavioral cohorts group members by an action they took (attended the first live class, used the community feature, opened the welcome email), and they answer “what early behavior predicts long-term retention.” Segment or time-based cohorts slice by plan tier, price point, or geography. Predictive cohorts use early signals to flag members likely to churn before they actually cancel.
Appcues recommends starting with acquisition cohorts to spot whether retention trends are improving cohort over cohort, then layering behavioral cohorts once you know when the drop happens, so you can diagnose why. Predictive cohorts come last, once you have enough behavioral data to build a reliable early-warning signal.
For a membership business, that sequencing might look like: join-month cohorts first (acquisition), then a cohort split by whether members attended their first live session in week one (behavioral), then a cohort split by annual versus monthly plan (segment).
| Cohort Type | Question It Answers | Membership Example |
|---|---|---|
| Acquisition | Is retention improving over time? | Members grouped by join month |
| Behavioral | What early action predicts retention? | Attended first paid event vs. did not |
| Segment/time-based | Does plan or price affect retention? | Monthly plan vs. annual plan cohorts |
| Predictive | Who is likely to churn next? | Members flagged by declining login frequency |
Run acquisition first. It’s the cheapest to build and it tells you whether you even have a retention problem worth digging into further.
Data Requirements and Metrics for Reliable Membership Cohorts
Cohort tables are only as good as the event data underneath them. You need five fields, minimum: a unique member_id that never changes even if the member updates their email or payment method, a member_since timestamp that is set once and never overwritten, every charge and renewal event with its own timestamp, a cancellation timestamp (not just a status flag), and a plan_id to segment by tier.
Two metrics matter more than the rest. Logo cohorts track the raw count of members retained at each age, regardless of what they’re paying. If your membership site has multiple tiers, run both.
Common data pitfalls that quietly corrupt cohort tables:
- A mutable “member_since” field that resets when a member pauses and reactivates, which makes veteran members look like new joiners.
- Duplicate accounts from failed payment retries or email changes, inflating cohort size without adding real members.
- Timezone and billing-cycle mismatches, where a renewal that happens at 11:58 PM gets bucketed into the wrong month.
Stripe’s guidance on cohort infrastructure is blunt about this: data infrastructure, not analysis technique, is the most common point of failure in cohort reporting.
Pro Tip: Set member_since once, at first successful payment, and never touch it again, even if the member’s plan changes. Every other event (upgrades, pauses, cancellations) gets its own timestamped record instead of overwriting the anchor.
How to Build a Membership Cohort Matrix Step by Step
Before writing a single query, answer one question: what decision will this cohort table inform? “Should we change our onboarding email sequence” needs a different granularity than “should we adjust annual pricing.” Vague questions produce cohort tables nobody acts on.
- Pick your anchor event. First successful payment beats signup date, since it reflects who actually became a paying member, not who abandoned checkout.
- Choose granularity. Weekly cohorts surface onboarding problems faster, since new members either engage or drop within the first two weeks. Monthly cohorts smooth out noise and work better for programs with slower activation cycles, like annual coaching memberships.
- Set your retention window. Twelve months is standard for membership businesses; go shorter (eight to ten weeks) if you’re specifically testing onboarding changes.
- Write the cohort query. Group members by their anchor month, then count how many were still active at each subsequent age period.
- Normalize to percentages. Raw counts don’t compare across cohorts of different sizes; percentage retained does.
- Visualize as a heatmap or line chart and push it to a dashboard your team actually checks weekly.
Here’s the SQL skeleton, adapted for a typical members-and-charges schema:
WITH cohort_base AS (
  SELECT member_id,
         DATE_TRUNC('month', member_since) AS cohort_month
  FROM members
),
activity AS (
  SELECT c.member_id,
         c.cohort_month,
         DATE_TRUNC('month', charges.charge_date) AS activity_month,
         DATEDIFF('month', c.cohort_month, DATE_TRUNC('month', charges.charge_date)) AS cohort_age
  FROM cohort_base c
  JOIN charges ON charges.member_id = c.member_id
)
SELECT cohort_month,
       cohort_age,
       COUNT(DISTINCT member_id) AS retained_members
FROM activity
GROUP BY cohort_month, cohort_age
ORDER BY cohort_month, cohort_age;
The JOIN ties every charge event back to the member’s original cohort month. The window-style DATEDIFF calculation is what generates “age” (months since joining), which is the column header of your matrix. GROUP BY cohort_month and cohort_age produces exactly the rows-and-columns structure a cohort table needs: rows are join cohorts, columns are age periods, cells are retained counts. Divide each cell by the cohort’s month-0 count to normalize into a percentage.
If SQL isn’t your team’s daily tool, Mixpanel, Amplitude, and Matomo all ship built-in cohort reports that skip the query writing entirely. They’re faster for quick checks. SQL wins when you need the numbers tied precisely to billing events for financial reporting, since tool-native cohorts sometimes define “active” loosely (a login) rather than tying it to an actual paid renewal.
Pro Tip: Export the normalized percentage table, not the raw counts, into your BI tool. A heatmap colored by retention percentage makes the leak point visible in about three seconds, long before anyone reads a single number.
Reading Retention Curves and Turning Them Into Action
Three curve shapes show up again and again. A flattening curve, where retention drops sharply early then levels off around a stable percentage, is a good sign: it means the members who survive the first month or two tend to stick around. A continuous decay curve, where retention keeps sliding with no floor, signals a systemic problem, often pricing misalignment or a product that doesn’t deliver ongoing value. A mid-life dip, where retention holds steady early then drops around month four or five, usually points to a specific triggering event, like an annual-to-monthly proration surprise or content fatigue.
ChurnDefense’s framework for reading these curves ties directly to intervention design: overlaying your most recent cohorts against older ones tells you whether retention is trending up or down before a full year of data comes in.
Match the intervention to the curve:
- Sharp month-1 drop-off: fix onboarding sequencing, not pricing.
- Continuous decay with no flattening: rework the core value proposition or content cadence.
- Mid-life dip: audit billing events and content calendars around that specific age window.
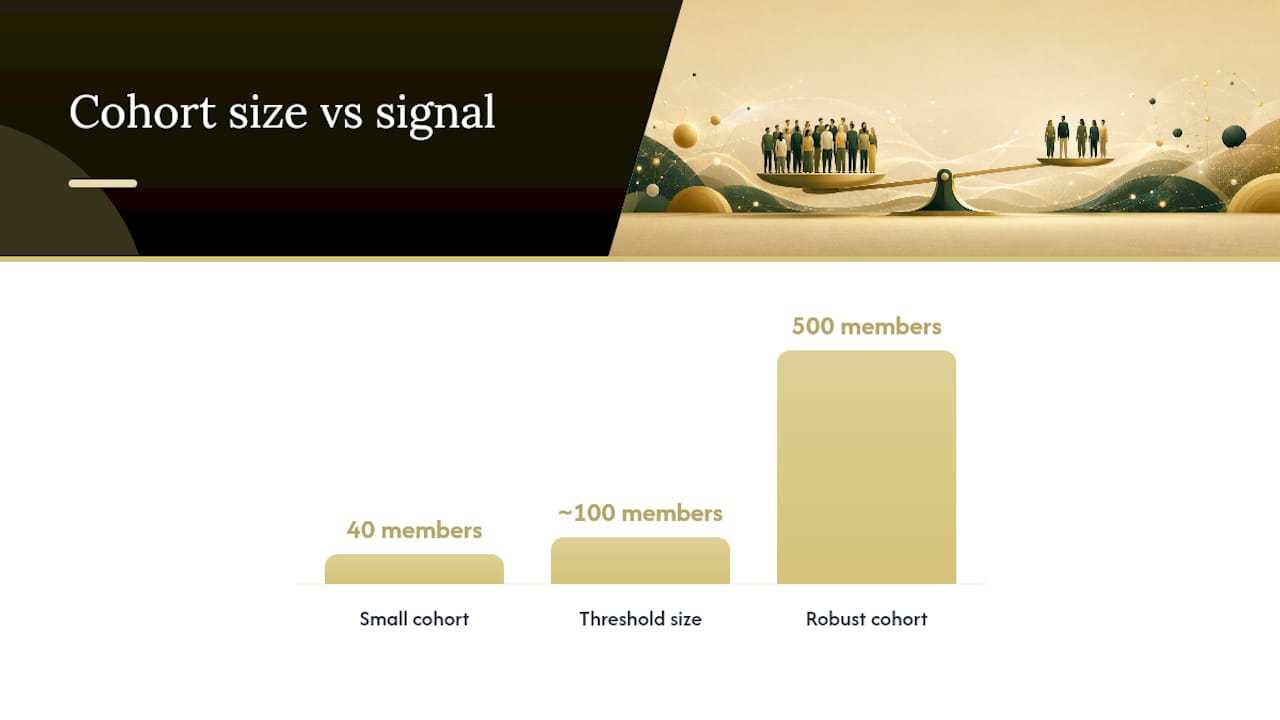
Before running an A/B test on any fix, check cohort size. A cohort under roughly 100 members produces retention percentages that swing wildly month to month from noise alone, not real behavior change. Merge adjacent monthly cohorts into a quarterly cohort if your program is small enough that individual months look jagged. Give any test at least two full retention cycles before calling a winner. A 5 percentage point retention lift in a cohort of 40 people tells you almost nothing; the same lift across 500 members is a real signal worth scaling.
Common Mistakes That Break Membership Cohort Analysis
The single most damaging mistake is comparing cohorts by calendar month instead of by age. If you’re comparing what January’s cohort looked like in month three against what March’s cohort looks like in month one, you’re comparing two different maturity stages and drawing false conclusions about which acquisition channel performed better. Cohort age alignment is non-negotiable for valid comparisons.
Other traps worth avoiding:
- Slicing cohorts so finely (by day, by micro-segment) that each group has too few members to produce a stable signal.
- Treating “member_since” as editable, which silently corrupts every downstream age calculation.
- Running the analysis once and shelving it, rather than assigning an owner and a monthly cadence.
- Building cohort dashboards nobody links back to actual experiments, so the insight never turns into an action.
Pro Tip: Assign one person to own the cohort dashboard and review it on the same day every month, tied to your billing cycle close. A cohort report nobody owns becomes a report nobody reads.
How Money-plug Uses Cohort Thinking in Creator Launches
Money-plug applies cohort-style measurement to every creator launch it runs, tracking members by their join cohort against first paid event attendance, the same behavioral signal PCMA recommends for finding the tipping point where casual members become long-term ones.

On one program launch that generated over 3,000 sales in ten days, the team tracked which members engaged with the first onboarding touchpoint within 48 hours versus those who didn’t, then built a targeted follow-up sequence for the lagging group.
The lesson for any membership or creator team: don’t wait for a full month of blended churn data. Pick one early behavioral signal, split your newest cohort by it within the first week, and build your intervention around whichever half is lagging.
What This Runbook Gets Right That Most Advice Misses
Most cohort analysis content treats it as an analytics exercise: build the matrix, admire the heatmap, move on. That’s backwards for membership businesses. The matrix is diagnostic scaffolding. The actual value shows up only when a specific retention drop gets mapped to a specific fix, tested against a specific cohort, and measured against the next one.
Conventional advice also overweights tool sophistication and underweights data hygiene. A team with clean member_since anchors and basic SQL will outperform a team running expensive analytics software on duplicated accounts and mutable start dates every time. Fix the data model first.
If you’re just starting, resist the urge to build acquisition, behavioral, and predictive cohorts simultaneously. Run acquisition cohorts for one full cycle, find your worst age-based drop-off, then layer one behavioral cohort split around that exact point. Depth beats breadth here. A membership team that masters one cohort split, tied to one real intervention, will move retention further in a quarter than a team that dashboards everything and acts on nothing.
— Money
Sources
- The Complete Guide to Cohort Analysis | Amplitude
- Cohort analysis for SaaS: types, how-to guide, and examples | Appcues
- Cohort analysis for businesses | Stripe
- Customer cohort analysis: How to read retention curves and act on them | ChurnDefense
Check your own analytics tool’s documentation for platform-specific cohort features before building a custom SQL pipeline.