Increase Lifetime Value: 3 Moves That Move the Needle
Increase Lifetime Value: 3 Moves That Move the Needle

Increasing lifetime value means raising the gross profit you earn from a customer across the entire relationship, not just the size of their first order. Three levers move that number: retention first, because it compounds every other input over time. Expansion second, because it grows revenue from people who already trust you. And margin third, because CLV is a profit metric, not a revenue metric. Start this week by building a cohort table of customers grouped by acquisition month and tracking one headline number: gross profit per cohort at 90 days.
- Retention — fixes lifespan, the multiplier behind every other number.
- Expansion — grows order size and frequency from existing buyers.
- Margin — often the fastest lever because it requires no new sales at all.
A 5% improvement in retention can lift profitability by 25% to 95%, according to Wharton research on customer economics. That single number should decide where your next quarter of effort goes.
Key Takeaways
Increasing lifetime value comes down to prioritizing retention first, expansion second, and margin third, then measuring the result with a cohort-based CLV baseline.
| Point | Details |
|---|---|
| Retention leads | A 5% retention gain can lift profitability by 25% to 95%, making it the first lever to pull. |
| Use the profit formula | Calculate CLV with gross margin included, not just revenue, to find your truly valuable customers. |
| Pick three tactics | Match tactics to your weakest input (retention, frequency, AOV, or margin) and run them for a full quarter. |
| Build a cohort baseline | Group customers by acquisition month and track AOV, frequency, and margin to estimate profit CLV. |
| Get expert execution | Money Plug Lab runs this exact retention-and-expansion playbook for creators on a pure revenue-share model. |
Table of Contents
- What Is Customer Lifetime Value and How Do You Calculate It?
- Why Does Increasing Lifetime Value Matter for Growth?
- What Factors Actually Move Lifetime Value?
- How Do You Measure and Estimate CLV?
- Which Strategies Actually Increase Lifetime Value?
- Where in the Customer Journey Should You Focus First?
- How Do You Prioritize Experiments and Prove They Worked?
- What Does a Real CLV Improvement Look Like in Practice?
- What Should Business Owners Actually Prioritize First?
- How Money Plug Lab Turns These Levers Into Revenue
- Where to Learn More About Increasing CLV
- Frequently Asked Questions
- Sources
What Is Customer Lifetime Value and How Do You Calculate It?
Customer lifetime value (CLV, sometimes written LTV) is the gross profit you can expect from a customer over the full span of their relationship with your business, not just their first purchase. Two formulas cover most situations.
The simple version: CLV = average order value × purchase frequency × customer lifespan. It’s fast, but it treats every dollar of revenue as equal, which it isn’t.
The profit-aware version fixes that: CLV = (average order value × purchase frequency × gross margin %) ÷ churn rate (or multiplied by lifespan in years, if you prefer that unit). This version answers the question that actually matters to your bank account: how much profit, not revenue, does this customer generate?
Here’s why the difference matters. A customer who spends $100 four times a year for three years has $1,200 in simple revenue-based CLV. If your gross margin is 40%, the profit-aware CLV is $480. If a competitor’s product has a 60% margin instead, their CLV jumps to $720 on identical revenue.
The moment you switch from a revenue formula to a profit formula, half your “best customers” change places. Some of your loudest revenue generators are quietly unprofitable once support costs and discounts get subtracted.
Pro Tip: Run both formulas side by side once. The gap between them tells you exactly how much margin is currently invisible in your reporting.
Why Does Increasing Lifetime Value Matter for Growth?
CLV sets the ceiling on what you can afford to spend acquiring a customer. If your average customer generates $150 in gross profit, spending $200 to acquire them is a losing trade no matter how good your ad creative looks. Get the ratio backward and growth accelerates your losses instead of your revenue.
The retention math backs this up hard: a 5% retention increase can lift profitability by 25% to 95%. That range is wide because the effect compounds. A customer who stays six extra months doesn’t just buy once more. They buy more, refer more, and cost less to serve with every additional cycle.
This is why mature teams treat CLV as a budgeting tool, not a reporting metric. Before increasing ad spend, ask whether the money would do more work fixing a leaky retention curve. Often it would.
What Factors Actually Move Lifetime Value?
CLV has a small number of moving parts, and each one responds to different tactics.
- Retention and churn — the biggest lever, moved by onboarding quality, product fit, and proactive support.
- Purchase frequency — moved by replenishment reminders, habit-forming content, and scheduled touchpoints.
- Average order value (AOV) — moved by bundles, tiered pricing, and smart upsell placement.
- Gross margin and cost to serve — moved by reducing support tickets, cutting blanket discounts, and shifting routine questions to self-serve.
- Referrals and viral lift — moved by making the product genuinely worth talking about, not just incentivized sharing.
- Fit at acquisition — moved by targeting the buyers who resemble your best existing customers, not just the cheapest clicks.
Margin deserves special attention because it’s the one input you can improve without selling anything new. A poorly handled support experience quietly erodes CLV long before churn shows up in your dashboard.
How Do You Measure and Estimate CLV?
Build a real baseline before you touch a single tactic. Here’s the three-step spreadsheet recipe.
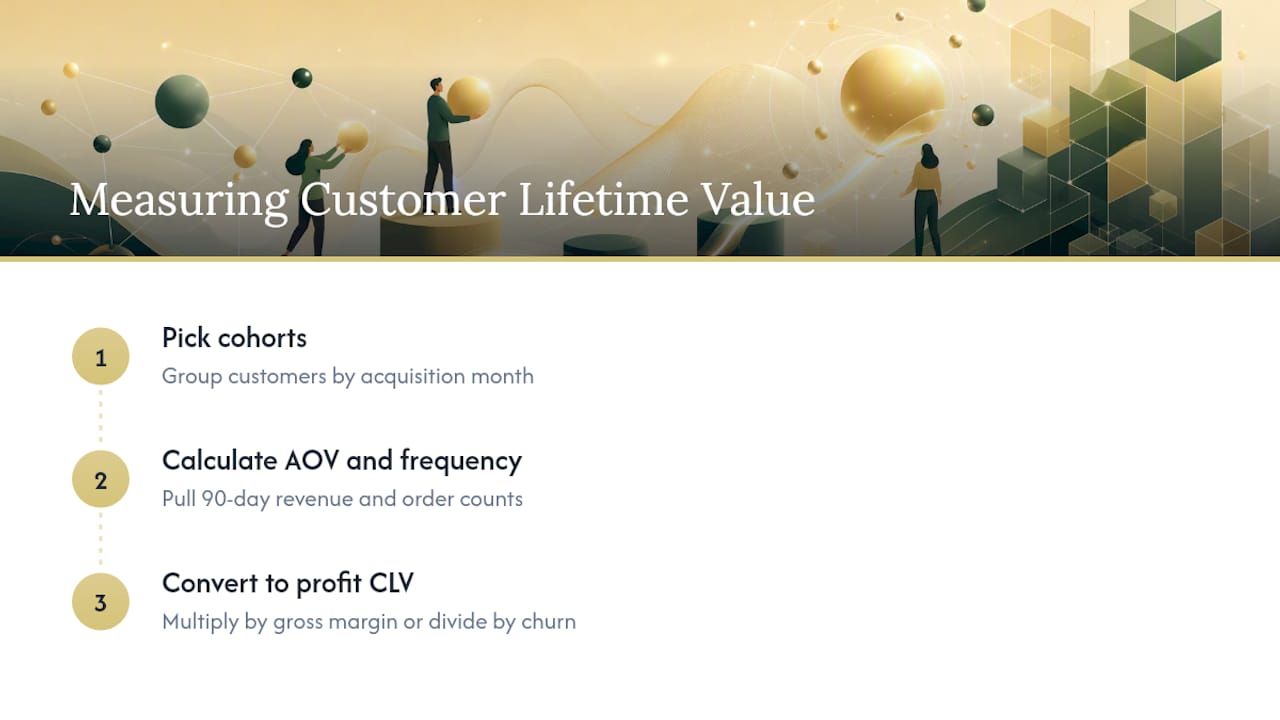
Step 1: Pick cohorts. Group customers by acquisition month. Thirty days is plenty of resolution for most small and mid-size businesses.
Step 2: Calculate AOV × frequency per cohort. Pull total revenue and order count for each cohort over 90 days, then divide to get average order value and purchase frequency separately.
Step 3: Apply gross margin or divide by churn. Multiply the revenue figure by your gross margin percentage, or divide by your observed churn rate, to convert revenue CLV into profit CLV.
A rough example: a cohort with $80 AOV, 2.5 average purchases, and 35% gross margin gives you $70 in profit CLV per customer. Compare that against your customer acquisition cost, and you have a real LTV:CAC ratio to work from. Most healthy ecommerce brands target roughly 3:1 on that ratio.
Track these numbers weekly or monthly depending on your order volume: AOV, repeat purchase rate, churn rate, net revenue retention, CLV:CAC, and gross margin per cohort.
A spreadsheet with three cohorts and six months of history will tell you more about your business than any dashboard vanity metric ever will.
Pro Tip: Stick with historical, cohort-based CLV until you have at least 12 months of order history. Predictive models built on thin data just guess with more confidence.
Which Strategies Actually Increase Lifetime Value?
Pick three tactics based on your weakest input, not eight tactics based on what sounds exciting.
- Fix onboarding friction first. Map where new customers drop off in the first 14 days and remove the single biggest blocker. KPI: day 14 retention rate.
- Build consumption-timed replenishment flows. Trigger reminders based on actual usage patterns instead of a flat 30-day calendar. Consumption-timed flows often convert 30 to 60 percent better than generic ones. KPI: repeat purchase rate.
- Pitch subscriptions at the second order, not the first. Buyers who’ve already reordered convert to subscriptions at a far higher rate than first-time visitors. KPI: subscription opt-in rate at order two.
- Add targeted cross-sells based on purchase history. Recommend complementary products tied to what someone already bought, not generic “customers also viewed” widgets. KPI: attach rate.
- Build a discount-free VIP tier for top-decile customers. Reward loyalty with access and service, not margin-eating coupons. KPI: retention rate among top 10% of spenders.
- Suppress ad spend on customers who return products. Feed returns data back into your acquisition targeting to stop paying to reacquire poor-fit buyers. KPI: blended CAC after suppression.
- Add one-click post-purchase upsells. Offer a relevant add-on at the moment of highest intent, right after checkout. KPI: post-purchase AOV lift.
- Segment acquisition by fit, not just cost. Target lookalike audiences built from your highest-CLV customers instead of your cheapest converters. KPI: 90-day CLV of new cohorts.
Pro Tip: Running all eight at once guarantees you’ll never know which one actually worked. Pick three tied to your weakest input, run them for a full quarter, and only then add more.
Where in the Customer Journey Should You Focus First?
Map the journey in three stages: acquisition (how they find you), activation (the moment they get real value), and retention/expansion (everything after that first win).

Score each touchpoint on three criteria: how many customers pass through it, how much it could move lifespan, frequency, or AOV, and how easy it is to test. A checkout upsell scores high on ease but often low on lifetime impact. A broken onboarding flow scores lower on ease but massively higher on impact.
Segmentation changes everything here. The same fix applied to customers acquired through paid search versus organic referral can produce completely different results, because the customers worth keeping aren’t evenly distributed across channels.
Pro Tip: Segment your journey map by acquisition channel before you segment by anything else. It usually reveals which channel is quietly bringing in your least loyal customers.
How Do You Prioritize Experiments and Prove They Worked?
Score every candidate experiment on Impact, Confidence, and Ease, then multiply the three scores to rank them.
- Score Impact (1 to 5): how much could this move your weakest CLV input if it works?
- Score Confidence (1 to 5): how much evidence, internal or external, supports this working here?
- Score Ease (1 to 5): how fast can you ship it with current resources?
- Multiply and rank. Run the highest-scoring experiment first, not the loudest idea in the room.
A quick payback example: if a $5 lift in AOV across 1,000 monthly customers adds $5,000 in monthly gross profit, and the experiment cost $2,000 to build, payback lands inside the first month. Give quick wins like AOV tests four weeks. Give retention experiments 8 to 12 weeks, since lifespan effects take longer to surface in the data.
What Does a Real CLV Improvement Look Like in Practice?
One creator monetization launch Money Plug Lab ran generated more than 3,000 sales in ten days, part of a broader track record exceeding $500,000 in tracked revenue across seven launched programs, including a campaign that returned 18x on ad spend.
The tactics behind that result mapped directly to the retention and expansion levers: tighter audience fit at acquisition, a product architecture built around habit-forming engagement, and sales copy that pre-qualified buyers before they ever saw a price tag.
An 18x return on ad spend doesn’t happen by spending more. It happens by making sure the right person sees the offer at the right moment in their relationship with the creator.
This kind of lift transfers best to creators and coaches with an engaged existing audience and a product that solves one specific problem well.
What Should Business Owners Actually Prioritize First?
Most advice on lifetime value treats retention, expansion, and margin as equally weighted levers you should balance evenly. That’s backward. Retention compounds; the other two don’t, at least not the same way. A customer who sticks around six extra months doesn’t just contribute six more months of revenue. They buy more per visit, cost less to support because they already know how the product works, and refer people who convert at higher rates than cold traffic ever will.

The overrated advice is chasing AOV first because it’s the easiest thing to A/B test. It’s easy precisely because it’s shallow. A five-dollar bump in average order value feels like progress, but it does nothing for a customer who churns after one purchase anyway.
If you take one thing from this article, take this: find your weakest input, whether that’s lifespan, frequency, or margin, and fix that one thing before you touch anything else. Businesses that spread effort evenly across all three levers usually end up mediocre at all of them instead of excellent at the one that matters.
How Money Plug Lab Turns These Levers Into Revenue
Money Plug Lab exists specifically to run the retention and expansion playbook described above, without asking you to front a single dollar first. We handle audience research, product architecture, pricing strategy, sales copy, video sales letters, and the paid advertising that drives the launch, all built around raising gross profit per customer rather than just moving units.
This model fits creators, coaches, and personal trainers with an engaged audience but no system for turning that audience into a recurring paid community or program. We work on pure revenue share, so our incentives sit on the same side of the table as yours. If you want to see how these tactics played out in a real launch, visit the Money Plug™ creator monetization page and request a discovery call to map your own weakest LTV input before your next launch.
Where to Learn More About Increasing CLV
For deeper study, see Wharton’s retention-profit research on the ROI of retention, Perspective AI’s three-lever framework, RetentionLab’s tactical playbook, Drip’s CLV formula guide, and Shopify’s 16 proven tactics.
Frequently Asked Questions
What’s a good LTV to CAC ratio? Most healthy businesses target roughly 3:1, meaning a customer generates three times what it costs to acquire them.
How long does it take to see CLV improve? Quick wins on AOV or upsells can show results in four weeks. Retention experiments usually need 8 to 12 weeks before the lifespan effect is visible in your data.
Should I use historical or predictive CLV? Stick with cohort-based historical CLV until you have at least 12 months of order history, since predictive models need that volume to be reliable.
Which lever should a small business start with? Whichever CLV input is weakest in your cohort data. For most young businesses, that’s retention, since a churn problem quietly undermines every other tactic you try.
Sources
- Customer Lifetime Value: What It Is and Why It Matters - Wharton
- Customer Lifetime Value (CLV): Formula + 8 Ways to Increase It | Drip