Ad Spend Allocation for Creators: 70-20-10 to Equalize Marginal ROAS
Ad Spend Allocation for Creators: 70-20-10 to Equalize Marginal ROAS

Allocate ad spend using a marginal-ROAS-driven 70-20-10 framework: 70% to proven performers, 20% to scaling opportunities, and 10% to tests. Before you touch the split, set a learning-floor budget so each core campaign gets enough spend for the algorithm to actually learn.
TL;DR:
- Campaigns with over 14 days of sustained ROAS above break-even should generally remain untouched unless clear signals suggest a change.
- The 70-20-10 framework emphasizes cautious scaling, testing new tactics with a fixed 10% test budget, and reallocating based on marginal ROAS divergence of 15% or more.
- Budgets must meet specific unit economics thresholds, with at least 30 conversions per month and appropriate minimum spends per platform to ensure meaningful data.
- Channel roles and the timing of funnel stages impact allocation, with search capturing existing demand first before investing in awareness channels like YouTube and TikTok.
- Automated bidding tools are effective when combined with disciplined manual thresholds for tier promotion, demotion, and testing to prevent algorithm fatigue and inefficient spending.
Table of Contents
- Quick Takeaways for Smarter Ad Spend Allocation
- A Repeatable Allocation Framework: 70-20-10 Plus Marginal ROAS
- Setting Your Budget Floor and Ceiling From Unit Economics
- Channel Allocation Examples by Business Goal
- Operational Playbook: Audit, Signals, and Cadence
- What Real Creator Launches Show About Ad Spend Allocation
- Incorporating Attribution Models Into Allocation Decisions
- Handling Multi-Channel Synergy and Cannibalization
- Automation and AI in Ad Spend Optimization
- When to Bring in an Agency vs. Managing Allocation In-House
- How Money-plug Handles Ad Spend Allocation for Creator Launches
- Sources
- FAQ
Quick Takeaways for Smarter Ad Spend Allocation
Here’s the shorthand version, before the mechanics.
- 70% (proven performers): campaigns with ROAS above break-even for 14+ consecutive days. Leave them alone unless a signal stack says otherwise.
- 20% (scaling candidates): campaigns showing improving trends but without a two-week track record yet. Feed them cautiously.
- 10% (tests): new audiences, creative angles, or channels. Cap the downside and expect some to fail.
- Learning floor: roughly 30 conversions a month per core campaign is the point where automated bidding starts making good decisions instead of guessing. Below that, expect noisy, expensive data.
- Reallocation trigger: move budget when marginal ROAS between two campaigns or channels diverges by 15% or more, not on gut feel.
- Scaling steps: increase winning campaigns by 20 to 30% increments, never by doubling overnight.
- Test budget protection: keep your 10% test tranche sacred. Raiding it to “save” a struggling campaign is how brands stop finding their next winner.
Pro Tip: Write your tier criteria down before you launch anything. “Above break-even for 14 days” sounds obvious until Monday morning arrives and a campaign is at day 11 with promising numbers, and you’re tempted to promote it early. Rules written in advance keep you from talking yourself into bad decisions.
A Repeatable Allocation Framework: 70-20-10 Plus Marginal ROAS
The 70-20-10 split isn’t just a nice round number. It’s a way of forcing discipline onto a budget that would otherwise drift toward whatever campaign got attention last week.
Proven performers (70%) are campaigns that have held ROAS above break-even for at least 14 straight days, with enough volume that the number means something. A campaign that hit a good ROAS on three days of unusually cheap traffic doesn’t qualify. Fourteen days smooths out weekday/weekend noise and gives you a real read.
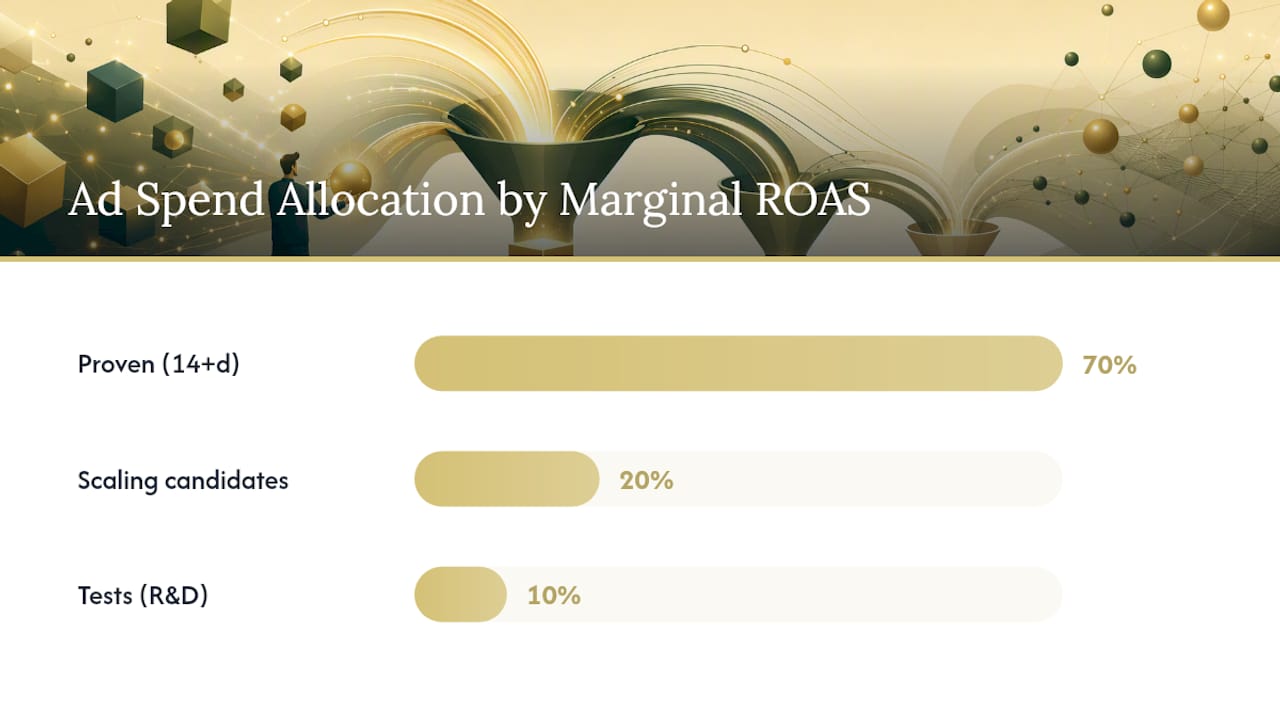
Scaling candidates (20%) are campaigns trending in the right direction but still short of that two-week bar, or proven campaigns you’re deliberately pushing harder to find their ceiling. This tier is where most of your active decision making happens week to week.
Tests (10%) cover new creative, new audiences, or entirely new platforms. Treat this money as R&D. Some of it disappears with nothing to show for it, and that’s the cost of finding your next scaling candidate.
The part most people skip is the difference between marginal ROAS and average ROAS. Average ROAS tells you how a campaign has performed overall. Marginal ROAS tells you what the next dollar you spend is likely to return, and it’s the number that should actually drive reallocation.
The goal is to equalize marginal ROAS across channels, not to chase the highest average number on the dashboard.
Promotion and demotion rules need real sample sizes, not vibes:
- Promotion to proven performer: 14+ days above break-even AND at least 30 to 50 learning-grade conversions in that window.
- Demotion from proven performer: three or more consecutive days of declining ROAS combined with rising frequency or falling impression share, not a single bad day.
- Graduation from test to scaling: a test campaign that clears its target CPA for seven straight days with at least 15 conversions earns a shot at the 20% tier.
- Kill criteria for tests: if a test burns through its allocated tranche without approaching target CPA, cut it. Don’t extend “just a little more” repeatedly.
Size your test tranche around what you can afford to lose without disrupting cash flow, not around what feels exciting. A $10,000 monthly budget might run $1,000 in tests. A $2,000 budget might only support one test at a time, run sequentially rather than in parallel, simply because splitting it further won’t produce a usable signal either way.
Pro Tip: Set your exit criteria before the test launches, not after you see the first week’s numbers. “Kill it if CPA is above $80 after $500 spent” is a rule. “Let’s see how it does” is a way to keep a losing test alive out of sunk-cost attachment.
Setting Your Budget Floor and Ceiling From Unit Economics
Most budgeting advice skips the math entirely and jumps straight to percentages of revenue. That’s backward. Your floor and ceiling should come from your numbers, with revenue percentages used only as a sanity check afterward.
The floor is the minimum spend needed for a campaign to reach learning-grade volume, generally around 30 conversions a month. Calculate it like this: take your target cost per acquisition and multiply by 30.
Worked example: if your target CPA is $50, your floor is $1,500 a month for that single core campaign. Spend less than that and you’re not really testing the channel. You’re feeding it just enough money to generate confusing, statistically meaningless data.
The ceiling comes from your customer lifetime value and how long you’re willing to wait to recoup acquisition cost. If a customer is worth $300 in lifetime value and you’re comfortable waiting 90 days to break even on acquisition cost, your ceiling per customer is roughly $300, adjusted down for payback-period risk tolerance. Multiply that by your realistic monthly volume capacity and you get a defensible spend ceiling, not an arbitrary cap pulled from a percent-of-revenue rule.
Worked example: LTV of $300, target payback within 90 days, and a business comfortable acquiring 40 customers a month at that economics puts the ceiling around $12,000 a month for that acquisition channel, before diminishing returns kick in on marginal ROAS.
A fast-growing company with strong unit economics can often justify spending well above that range because every dollar in is still returning more than a dollar out. A company with thin margins might need to spend less than it even if competitors are outspending them.
| Business stage | Primary budget driver | Concentrate or diversify |
|---|---|---|
| Pre-learning floor | Reaching 30+ conversions/month per campaign | Concentrate on one core campaign |
| Learning floor cleared, scaling | Marginal ROAS across 2 to 3 channels | Moderate diversification |
| Mature, multiple proven channels | LTV-based ceiling per channel | Diversify within economics limits |
If your total budget can’t clear the learning floor on even one campaign, don’t spread it across five channels hoping one sticks. Concentrate first, get one channel producing a real signal, and only diversify once you have the budget to clear the floor on a second channel too.
Channel Allocation Examples by Business Goal
Starting splits differ by what you’re actually trying to accomplish, and funnel priorities shift the numbers further.
Search captures existing demand; Meta and LinkedIn create it.
For brand awareness, allocate a higher share to YouTube and Meta feed and reels placements, with a smaller Search allocation reserved for branded-term defense.
For e-commerce, Performance Max and Meta typically carry a large portion of spend combined, with the remainder split between Search for high-intent terms and TikTok for prospecting in younger demographics.
For professional services, LinkedIn and Search tend to be the primary channels, since the buying cycle is longer and the audience actively researches before converting.
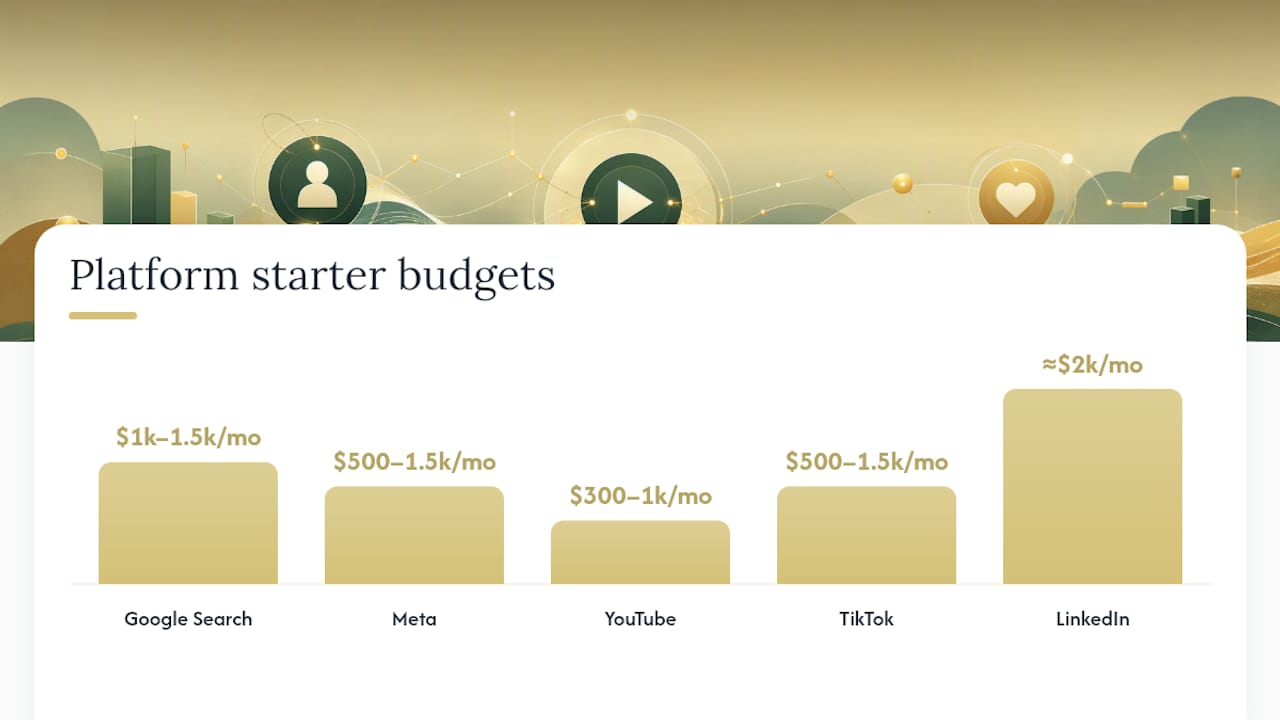
Platform minimums matter more than most budgets account for:
- Google Search: minimum viable spend usually starts around $1,000 to $1,500/month to gather meaningful signal on a few core keywords.
- Performance Max: needs enough conversion volume to feed its automated bidding, generally similar to Search minimums.
- Meta: $5 to $15 per day per ad set is the effective floor, translating to roughly $500 to $1,500/month for a functioning campaign.
- YouTube: typical starter spend runs $300 to $1,000/month to build enough view data.
- TikTok: similar range to Meta, though creative refresh needs to happen faster to avoid fatigue.
- LinkedIn: highest cost per result of the group, so budgets under $2,000/month often struggle to generate usable volume.
Funnel priority changes the order of operations: capture existing demand first with Search, then create new demand with awareness channels once your capture layer is efficient. Launching a YouTube brand campaign before your Search account is even converting well usually wastes the awareness spend, since you have no efficient capture mechanism waiting on the other end.
Cross-channel interaction is the part attribution dashboards handle badly. A customer who sees a YouTube ad, later searches your brand name, and converts through Search gets counted as a Search win in last-click reporting, when YouTube did real work. Watch for aggregated ROAS trends across the full account rather than trusting each platform’s self-reported numbers in isolation, since every platform tends to over-credit itself.
Operational Playbook: Audit, Signals, and Cadence
A framework only works if you actually run it. Here’s the operational version.
- Audit current spend by tier. Tag every active campaign as proven, scaling, or test based on your written criteria, not memory.
- Check learning-floor status. Flag any core campaign under its conversion threshold and either fund it properly or pause it.
- Pull marginal ROAS on recent increases. Look at your last budget change per campaign and calculate what the incremental dollars actually returned.
- Build your signal stack. Combine ROAS trend, frequency, and impression share into one view rather than checking each in isolation.
- Set your review cadence by spend level. Below $500/day, review weekly. Between $500 and $2,000/day, review every three to four days. Above $2,000/day, use daily automated rules with human oversight.
- Apply compound-signal rules before acting. Don’t pause or reallocate on one bad day. Require the signal stack to agree over multiple days before moving money.
- Scale in steps, not leaps. When a campaign earns more budget, increase it 20 to 30% at a time rather than doubling it, which resets the algorithm’s learning phase and tanks performance temporarily.
The signal stack itself deserves a closer look. A single day of falling ROAS means nothing. ROAS declining for seven straight days combined with rising ad frequency and shrinking impression share is a real drain signal, the kind that justifies pulling budget rather than waiting it out.
Structurally, separate your test campaigns from your scaled ones using different bidding structures. Many practitioners run Advantage+/ABO-style manual controls for experiments and CBO-style automated budget optimization for scaled campaigns, so tests don’t get algorithmically starved by a platform that assumes bigger campaigns deserve more of the budget.
Pro Tip: *If you keep resetting learning phases by scaling too aggressively, you’re not actually optimizing anything, you’re just paying tuition to the algorithm every week.
What Real Creator Launches Show About Ad Spend Allocation
An example agency works with content creators on a pure revenue-share basis, building and launching digital products from scratch: audience research, pricing, sales copy, video sales letters, and the paid advertising that carries the launch. There’s no upfront cost to the creator, which means the incentive to allocate spend well isn’t theoretical. It directly affects what everyone gets paid.
Those numbers don’t happen from spreading a launch budget evenly across every platform on day one. They happen from concentrating spend where the signal is strongest, then scaling in controlled steps once a campaign clears its learning floor.
Three takeaways for creators setting their first launch budget:
- Don’t split a small launch budget across five platforms. Pick the one or two channels most likely to reach your existing audience and fund them past the learning floor first.
- Treat launch week differently from steady-state. A ten-day launch window needs front-loaded spend and daily monitoring, not the weekly cadence appropriate for a mature evergreen campaign.
- Track marginal ROAS from day one, not just total return. An 18x campaign didn’t stay at 18x forever. Knowing when the marginal return started declining is what tells you when to shift budget to the next opportunity instead of over-scaling a saturating winner.
Incorporating Attribution Models Into Allocation Decisions
Last-click attribution is still the default in a lot of ad accounts, and it’s quietly distorting allocation decisions. It hands full credit to whichever channel happened to close the sale, even when an earlier touchpoint on a different platform did the work of creating demand in the first place.
Data-driven or multi-touch attribution models spread credit across the touchpoints that actually contributed, which changes how the 70-20-10 tiers look in practice. A YouTube campaign that appears to break even under last-click attribution might actually be a proven performer once you account for the Search conversions it’s quietly feeding downstream.
The practical fix isn’t necessarily buying an expensive attribution platform on day one. It’s checking your allocation decisions against more than one attribution window and model before you demote a campaign. If a channel looks weak under last-click but strong under a data-driven or first-touch model, treat that as a signal to investigate further rather than a reason to cut its budget immediately.
For creators and small teams comparing analytics tools to get a cleaner read on this, attribution platforms differ significantly in how they handle blended metrics, and the choice affects which campaigns look like scaling candidates versus which look like drains. Whatever model you settle on, apply it consistently across every channel in your allocation review. Switching models mid-review to justify a decision you’ve already made defeats the entire purpose.
Handling Multi-Channel Synergy and Cannibalization
Channels don’t operate in isolation, and pretending they do is one of the more expensive allocation mistakes. A Meta prospecting campaign can lift Search brand-term volume within days, while two retargeting campaigns on different platforms can quietly bid against each other for the same warm audience, inflating cost per result without adding incremental sales.
Synergy shows up as a lift you can’t attribute cleanly to any single channel. Cannibalization shows up as rising costs and flat or declining total conversions even though individual campaigns each look “fine” in isolation. The way to catch cannibalization is watching total account-level conversions alongside individual campaign ROAS, not just campaign-by-campaign performance in a vacuum.
A common pattern: retargeting on both Meta and Google Display targeting the exact same warm audience. Each campaign might show excellent ROAS on its own dashboard, because retargeting an already-warm visitor converts easily regardless of which platform gets the credit. But total incremental revenue from having both running rarely beats running one well-funded retargeting campaign and putting the other budget toward genuine prospecting.
The fix is sequencing your audiences deliberately: assign each channel a distinct role in the funnel (cold prospecting, warm retargeting, brand defense) instead of letting every channel target everyone. When you do see a genuine synergy effect, like YouTube views correlating with a lift in branded Search volume, that’s a reason to protect the YouTube budget even if its own direct-response ROAS looks mediocre in isolation. The channel is doing upstream work that a single-channel view can’t see.
Automation and AI in Ad Spend Optimization
Automated bidding systems have gotten good enough that fighting them manually is usually a losing strategy, and the smarter move is understanding what they need to work well. Every major platform’s algorithm needs volume to learn, which is exactly why the learning-floor concept matters more now than it did when manual bidding was the norm.
What automation still handles poorly is the strategic layer, deciding whether a campaign belongs in the proven, scaling, or test tier in the first place, and judging whether a dip is noise or a genuine drain.
AI-assisted budget tools can flag marginal ROAS divergence faster than a person scanning spreadsheets, which is genuinely useful. But they’re only as good as the rules and thresholds you feed them. A tool set to reallocate on any single day of underperformance will thrash your budget constantly, moving money around in response to noise rather than signal. Set the thresholds using the same compound-signal logic you’d apply manually (multiple days of declining ROAS plus rising frequency, not one bad Tuesday) and automation becomes a force multiplier instead of a liability.
The practical approach for most creators and small teams: automate the repetitive execution (scaling steps, pause rules, budget shifts within a tier), and keep the human judgment on tier promotion, demotion, and whether a new test deserves to graduate. That split tends to outperform either fully manual management or fully automated “set it and forget it” setups.
When to Bring in an Agency vs. Managing Allocation In-House
If you can’t clear the learning floor on your core campaigns, need to scale a launch fast, or simply don’t have the operational bandwidth to run a weekly signal-stack review, that’s usually the point to bring in outside help. Revenue-share agencies are worth considering specifically because the incentive lines up: they only make money when your campaigns actually work.
Below that, in-house management often means nobody has the time to actually run the cadence properly.
Revenue-share arrangements also change the cash-flow risk profile for creators launching their first paid product. There’s no upfront spend commitment sitting on your balance sheet before you know whether the offer converts.
— Money
How Money-plug Handles Ad Spend Allocation for Creator Launches
Most creators launching their first paid program are guessing at budget splits because nobody taught them the marginal-ROAS math or the learning-floor thresholds that actually govern platform performance. Money-plug removes that guesswork by running the entire launch on a revenue-share basis, meaning the agency’s incentive to allocate spend correctly is identical to yours: nobody gets paid until the ads actually convert.

That structure covers the full launch stack, not just the ad accounts: audience research, product architecture, pricing, sales copy, video sales letters, payment infrastructure, and the post-production work behind paid campaigns. If you’re a creator sitting on an engaged audience and wondering how to fund your first launch without burning cash on channels that haven’t cleared their learning floor, start a conversation with Money-plug about a revenue-share partnership.
Sources
The learning-floor figures come from ADSRUNNER’s ad spend decision framework. The 70-20-10 tiering and cadence guidance draw on Ryze’s ad spend planning template. Signal-stack and scaling-step rules come from Ad Library’s 7-step framework. Small-business starter budgets reference URI’s small business development guidance, and general budgeting practice draws on the SBA’s marketing budget guide.
- How much should you spend on ads? A decision framework · ADSRUNNER
- How to Optimize Ad Spend Allocation: A 7-Step Framework
- How much should my digital advertising budget be? · URI RISTBDC
FAQ
What is the 3-3-3 rule in marketing?
This isn’t a standard allocation framework covered by budget-planning research; if you’ve seen it referenced, check the specific source’s definition rather than assuming it matches the 70-20-10 model.
How is ad spend calculated?
Calculate your floor by multiplying target cost per acquisition by your learning-floor conversion goal (often around 30 conversions a month), and calculate your ceiling from customer lifetime value against your acceptable payback period.