Median 6.6% Sales Page Conversion Rate, Creators' Tests That Raise It
Median 6.6% Sales Page Conversion Rate, Creators’ Tests That Raise It

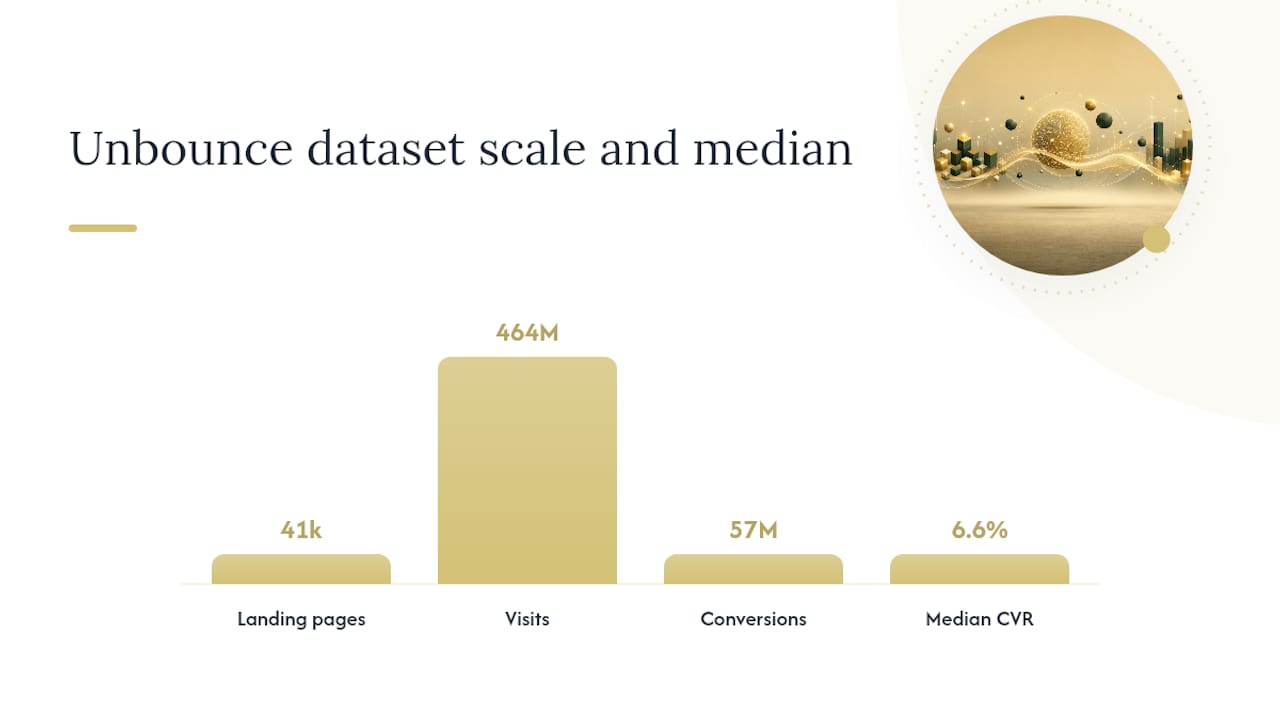
The median landing page conversion rate sits around 6.6% as of Q4 2024, according to Unbounce’s analysis of 41,000 pages. Treat 3-5% as workable, 8-10% as strong, and anything past 11% as genuinely elite for a single-offer page. If your sales page falls below 3%, stop guessing; calculate your actual rate first, then diagnose from there.
TL;DR:
- The median landing page conversion rate is 6.6%, with 3-5% being workable, 8-10% strong, and over 11% considered elite.
- Conversion rates vary significantly by traffic source, with email traffic crossing the highest, followed by retargeting, while paid social exhibits the lowest.
- Comparing blended traffic with single-channel benchmarks can be misleading; segment your data by source for accurate assessments.
- Offer type and page complexity strongly influence conversion rates, with lower commitments like newsletters reaching higher rates than high-ticket sales pages.
- Priority should be given to fixing message match, reducing friction, and improving mobile speed before testing design or pricing changes.
Table of Contents
- What Counts as a Good Sales Page Conversion Rate
- How Do You Calculate Your Sales Page Conversion Rate?
- Do Conversion Benchmarks Differ by Page Type?
- Which Tactics Actually Move the Needle First?
- How Do You Run a Valid A/B Test and Prove Business Impact?
- What Has Money Plug Lab Learned From Real Launches?
- Your 7-14 Day Conversion Sprint Checklist
- Why 2026 Changes the CRO Math for Creators
- How Money-plug Turns Traffic Into Tracked Revenue
- Sources
What Counts as a Good Sales Page Conversion Rate
Most creators ask the wrong first question. They want to know “what’s average” when the better question is “average compared to what.” Unbounce’s dataset, built from 41,000 landing pages, 464 million visits, and 57 million conversions, puts the median at 6.6%. That’s the most statistically honest large-sample number available right now, and it’s a median for a reason.
Medians beat means here because a handful of viral pages with 40%+ conversion rates would otherwise drag the “average” upward into fantasy territory. One page that converts at 45% because it went out to a warm email list of 200 superfans will wreck a mean calculated across a few hundred pages. A median ignores that noise and tells you where the typical page actually sits.
HubSpot’s 2026 CRO guide takes a different measurement approach and reports a cross-industry baseline closer to 1.7% for certain site-wide metrics. That’s not a contradiction, it’s a different denominator. Site-wide conversion counts every visitor across every page, including people who never intended to buy anything. A dedicated sales page built around one offer and one action will almost always outperform that number by a wide margin, which is exactly why SeedProd’s benchmark treats “average” and “good” as separate categories entirely.
Traffic source matters just as much as page design. A few patterns hold up consistently across benchmark reports:
- Email traffic tends to convert highest, since the audience already trusts the sender and clicked with intent.
- Paid search traffic usually lands in the middle, driven by buyer intent but diluted by browsers and comparison shoppers.
- Paid social traffic typically converts lowest on cold audiences, because interruption based discovery means less pre-existing purchase intent.
- Retargeting traffic across any channel tends to outperform cold traffic by a wide margin, since these are warmed up visitors.
Quick benchmark check: if your sales page pulls in mixed traffic sources and you’re comparing your blended rate against a single-channel benchmark, you’re comparing apples to a fruit basket. Segment your reporting by source before you judge your performance against any published number.
How Do You Calculate Your Sales Page Conversion Rate?
The formula is simple: divide total conversions by total visitors, then multiply by 100. A page that gets 2,000 visitors and generates 120 sales converts at 6%. That’s the whole equation. The complexity lives in what counts as a “visitor” and what counts as a “conversion,” and that’s where most creators quietly wreck their own data.
Here’s how to calculate it correctly and avoid the traps that skew your numbers:
- Pick one traffic metric and stick with it. Sessions and unique visitors are not the same thing. A visitor who returns three times in one day generates three sessions but counts once as a unique visitor. Mixing these across reporting periods makes month-over-month comparisons meaningless.
- Define your conversion event before you launch, not after. Decide whether a “conversion” means a completed purchase, a checkout initiation, or an email capture on a multi-step funnel. Reporting the wrong step inflates your rate and hides where people actually drop off.
- Separate macro and micro conversions. A sale is a macro conversion. An add-to-cart or a video-watched-past-50% is a micro conversion. Blending them into one number tells you nothing actionable about revenue.
- Tag every traffic source with UTM parameters. Without consistent UTM tagging, your CRM will misattribute sales to “direct” traffic, and you’ll optimize the wrong channel entirely.
- Wait for a real sample before trusting the number. A page with 80 visitors and 4 sales is technically “5%,” but that number can swing wildly with the next ten visitors. Treat anything under a few hundred visitors per variant as directional, not conclusive.
Pro Tip: Run your conversion rate calculation weekly, not daily, for the first month after launch. Daily numbers on a sales page are almost always noise, and chasing daily swings leads to premature changes that reset your data before it stabilizes.
Attribution gaps are the silent killer here. If your thank-you page doesn’t fire a tracking event, or your CRM maps a lead to the wrong campaign, your reported conversion rate can be off by several percentage points without any obvious error showing up in your dashboard.
Do Conversion Benchmarks Differ by Page Type?
Yes, significantly, and comparing a webinar registration page against a product page benchmark is one of the most common self-inflicted mistakes creators make. Offer complexity drives conversion rate more than almost any design choice you’ll make.
SeedProd’s benchmark data breaks this down by category:
- Webinar registration pages often convert between 20% and 40%, since the ask is free attendance rather than a payment.
- SaaS free-trial pages typically land between 3% and 5%, reflecting a low-commitment offer with some friction from account creation.
- Ecommerce product pages usually run 2.5% to 3.5%, dragged down by price comparison shopping and cart abandonment.
- Newsletter opt-in pages frequently outperform sales pages by a wide margin, since the barrier to entry is just an email address.
- High-ticket or B2B pricing pages convert lowest of the group, often in the low single digits, because bigger purchases involve longer consideration cycles and more stakeholders.
The pattern across all of these: the lower the commitment you’re asking for, the higher the conversion rate you should expect, and the higher the price or complexity, the more that rate compresses. A $47 mini-course page and a $997 coaching program page are not competing benchmarks, even if they’re built by the same creator using the same template.
Traffic quality shifts these numbers too. Organic traffic, especially from an engaged email list or a creator’s own community, tends to outperform cold paid traffic on the same page by a meaningful margin, simply because the audience already has context and trust built in before they land.
Which Tactics Actually Move the Needle First?
Not every optimization deserves equal attention, and testing randomly wastes the traffic you already have. The priority order below runs from highest expected impact to lowest, based on best-practice sequencing used across CRO guidance from Mailchimp, HubSpot, and Leadpages.
- Fix message match first. If your ad promises “lose 10 pounds without cardio” and your sales page headline talks about “transform your fitness journey,” visitors bounce before reading a word of your copy. Message match between the click source and the page headline is the single fastest lever available, because it costs nothing to fix and it’s usually broken somewhere. Hypothesis template: “Match headline copy to ad copy exactly → reduce bounce rate → increase time on page and downstream conversion.”
- Sharpen the offer and value proposition. Before touching design, ask whether the offer itself is compelling. A confusing bundle, an unclear price, or a vague outcome will sink even a beautifully designed page.
- Reduce CTA and form friction. Every extra form field costs you conversions. Test whether you actually need a phone number, a company name, or a dropdown menu before the sale, or if that information can be collected after checkout. Hypothesis template: “Cut form fields from 6 to 3 → reduce friction → increase submit rate by a measurable margin.”
- Layer in social proof strategically. Testimonials, screenshots of results, and specific numbers (“developed by Money-plug partners across seven launched programs”) build trust, but only when placed near the decision point, not buried at the bottom of the page.
- Audit page speed and mobile experience. Mailchimp’s CRO guidance flags mobile speed as a recurring silent conversion killer, since most creator sales pages now see the majority of their traffic on phones.
- Test personalization and pricing structure last. Payment plan options, urgency mechanics, and dynamic content changes require more engineering effort and should only get tested once the fundamentals above are locked in.
Guardrail metrics matter here too. A test that increases raw conversion volume but tanks lead quality is a loss dressed up as a win. If you’re running a coaching or course funnel, watch your demo-to-close rate or refund rate alongside your top-line conversion number, not instead of it.
Pro Tip: Separate your “quick win” tests from your “structural” tests on your roadmap. Copy tweaks, headline swaps, and CTA button colors can ship in days. Pricing structure changes and product bundling changes need more planning and a longer testing window, so don’t let them clog your near-term test queue.
How Do You Run a Valid A/B Test and Prove Business Impact?
A test isn’t valid just because it has a “variant B.” Running an underpowered test and calling the winner too early is how most creators fool themselves into thinking a change worked when it was actually random noise settling one way.

The workflow that holds up: form a specific hypothesis, calculate the sample size you need before launching (not after), run the test for a fixed duration that spans at least one full business cycle, and only call a winner once you hit statistical significance. Cutting a test short because one variant is “pulling ahead” on day two is the most common way creators corrupt their own data.
Prioritize which tests to run using a simple framework: expected impact, ease of implementation, and your confidence in the hypothesis. A test with high expected impact and low effort should always jump the queue ahead of a high-effort test with uncertain payoff.
| Test element | Low-traffic pages | High-traffic pages |
|---|---|---|
| Minimum sample size | Qualitative research first (heatmaps, recordings) | Formal sample size calculator before launch |
| Test duration | Extend until directional pattern holds | One to two full business cycles |
| Statistical approach | Frequentist tests often underpowered; treat results as directional | Frequentist or Bayesian both viable |
| Decision trigger | Heuristic fixes based on user behavior signals | Statistical significance threshold reached |
Turning a conversion lift into dollars is simpler than it sounds. HubSpot’s CRO guide walks through this same logic to show how conversion lifts compress cost-per-lead: the same ad spend now produces more leads, so your effective CPL drops proportionally.
- Impact × ease × confidence beats gut-feel prioritization every time.
- A one-point lift on a low-converting page is often easier to achieve than the same lift on an already-optimized page.
What Has Money Plug Lab Learned From Real Launches?
Working across several launched creator programs that generated significant tracked revenue taught a few lessons that don’t show up in generic CRO guides. One launch produced thousands of sales in ten days. Neither happened by accident, and neither happened from a single page tweak.
The sequence that produced those numbers followed a consistent order: deep audience research to nail down the exact language the target buyer already uses, a video sales letter built around that language rather than generic claims, a message-match pass between every ad creative and the corresponding landing page, and a retargeting layer that caught warm visitors who didn’t convert on the first visit. Each step compounded on the last instead of operating in isolation.
A short checklist worth stealing for your next launch:
- Confirm your VSL opens with the exact pain point your ad targeted, not a generic hook.
- Audit every ad-to-page pairing for message match before spending another dollar.
- Build a retargeting sequence before launch day, not after you notice traffic isn’t converting.
- Track lead quality, not just lead volume, especially on a revenue-share or commission structure.
Your 7-14 Day Conversion Sprint Checklist
- Audit message match across every ad, email, and page headline currently live.
- Confirm UTM tagging and thank-you page events fire correctly before trusting any reported number.
- Test your top three CTA and form-friction variants, running each for a full week minimum.
- Add or reposition social proof near your primary call to action.
- Check mobile load speed and fix anything past a few seconds.
- Prioritize remaining tests by traffic volume: low-traffic pages get qualitative research first, high-traffic pages get formal A/B tests.
Why 2026 Changes the CRO Math for Creators
AI-driven search results are quietly cutting click-through rates on organic listings, which means fewer cold visitors reach your sales page in the first place. That makes every visitor who does arrive more valuable, and it shifts the priority from squeezing incremental UX improvements toward getting creative and audience fit right the first time.
Creators running revenue-share launches feel this shift more directly than anyone. When you only earn on completed sales, chasing vanity lead volume is a losing game. Rapid creative testing, tight message match, and honest lead-quality tracking matter more than another round of button-color tests.
— Money
How Money-plug Turns Traffic Into Tracked Revenue
Most creators trying to fix a weak sales page are stuck choosing between hiring a freelance copywriter for the words, a separate developer for the page, and an ads manager for traffic, then hoping all three pieces actually work together. Some agencies offer a connected system on a revenue share basis with zero upfront cost, so nothing gets built without a direct line to sales.
That connected approach covers three things a sales page rarely gets when it’s built piecemeal: audience research that shapes the actual offer and message before a single word of copy gets written, a video sales letter and sales copy built from that research instead of generic templates, and a full launch optimization layer, including creative testing and payment infrastructure, that keeps improving after launch day instead of stopping once the page goes live. One recent course launch saw ROAS climb 3 to 8 times over using this same retargeting and message-match sequence.
If your sales page is underperforming the benchmarks in this guide, the fix usually isn’t one more A/B test. Visit Money-plug to request a discovery call and get a straight read on where your funnel is actually losing sales.
Sources
- What is the average landing page conversion rate? (Q4 2024 data)
- Conversion rate optimization (CRO) strategy for 2026
- Landing Page Conversion Rates: What’s a Good Rate in 2026?